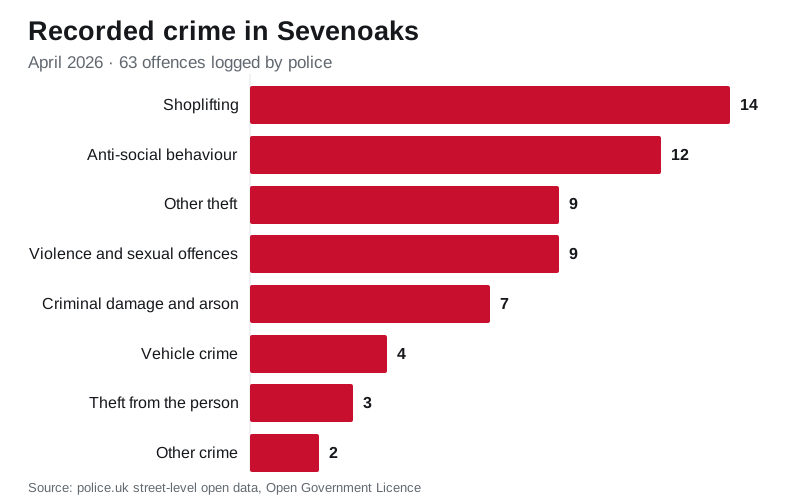

Sevenoaks town logged 86 crime reports in August, the fewest in two years. Burglary is down 54% on the year, shoplifting up 14%. Every figure, month by month.
Police logged 86 crimes and anti-social behaviour reports across the four Kent Police neighbourhoods that cover Sevenoaks town in August 2026. That is the lowest monthly total in the two years of figures on this page. It compares with 121 in August 2025 and 117 in August 2024.
Over the full year the picture is the same. The 12 months to August 2026 produced 1,270 reports, down from 1,399 in the 12 months before. That is a fall of 9.2 per cent.
The two categories that moved most are burglary and shoplifting:
- Burglary fell from 92 reports to 42, down 54 per cent. August’s six was the highest single month since June 2025, but still well below the double figures seen four times in the year before.
- Shoplifting rose from 195 to 223, up 14 per cent, and now ties with anti-social behaviour as the second most reported category. August’s ten was its lowest month since March 2025.
What these figures cover
This page uses Kent Police’s own neighbourhood boundaries rather than a circle drawn on a map. The four are Sevenoaks Town and St John’s, Sevenoaks Kippington, Sevenoaks Northern and Sevenoaks Eastern. Between them they stretch about 5.7km north to south and 3.8km east to west.
They do not include Riverhead and Dunton Green, Seal and Weald, or Otford and Shoreham, which Kent Police count as separate neighbourhoods, so this is the town rather than the wider district. The district figure is a different measure again: the district police commander told councillors on 10 September that crime across the whole of Sevenoaks district was down 3.1 per cent, without defining the period (our report).
These are offences recorded by the police, not convictions. One incident can produce more than one record, anti-social behaviour is an incident rather than a crime, and reports depend partly on how many officers are out looking: a rise can mean more policing rather than more offending. The numbers come from the police.uk open-data service and are published here under the Open Government Licence.
Crime in Sevenoaks by type, the year compared
| Crime type | 12 months to Aug 2026 | 12 months to Aug 2025 | Change |
|---|---|---|---|
| Violence and sexual offences | 358 | 370 | down 12 |
| Anti-social behaviour | 223 | 219 | up 4 |
| Shoplifting | 223 | 195 | up 28 |
| Criminal damage and arson | 105 | 121 | down 16 |
| Other theft | 99 | 113 | down 14 |
| Vehicle crime | 89 | 123 | down 34 |
| Burglary | 42 | 92 | down 50 |
| Drugs | 42 | 40 | up 2 |
| Public order | 32 | 55 | down 23 |
| Other crime | 28 | 31 | down 3 |
| Theft from the person | 9 | 14 | down 5 |
| Possession of weapons | 8 | 13 | down 5 |
| Bicycle theft | 6 | 8 | down 2 |
| Robbery | 6 | 5 | up 1 |
| All reports | 1,270 | 1,399 | down 129 |
Burglary is still the clearest change. In the 12 months to August 2025 it reached double figures in four separate months and peaked at 16 in September 2024. Since July 2025 it has stayed between two and six a month.
Shoplifting jumped to 28 in August 2025 and 27 in September 2025, and ran at 15 to 25 a month after that. August 2026 is the first month since the spring of 2025 when it fell back to ten.
The latest month: August 2026
August 2026 had 86 reports, down from 96 in July.
| Crime type | August 2026 | August 2025 |
|---|---|---|
| Anti-social behaviour | 25 | 24 |
| Violence and sexual offences | 22 | 28 |
| Shoplifting | 10 | 28 |
| Vehicle crime | 7 | 10 |
| Burglary | 6 | 3 |
| Other theft | 4 | 11 |
| Criminal damage and arson | 4 | 10 |
| Drugs | 4 | 1 |
| Public order | 2 | 2 |
| Other crime | 1 | 2 |
| Bicycle theft | 1 | 0 |
| Possession of weapons | 0 | 2 |
| All reports | 86 | 121 |
Where reports are logged
Police do not publish exact addresses. Every report is snapped to the nearest point on a published list, which is usually a street but can also be a generic label such as “Supermarket”, “Parking Area”, “Petrol Station” or “Hospital”. Those labels cover every site of that kind in the area, which is why they top the list, and a street named here is the nearest marker to the report, not necessarily where anything happened.
The most used locations over the 12 months to August 2026:
- Parking Area: 176 reports
- Supermarket: 85 reports
- Otford Road: 59 reports
- Buckhurst Avenue: 48 reports
- Hospital: 41 reports
- High Street: 35 reports
- Petrol Station: 34 reports
- Queen’s Drive: 28 reports
Shoplifting alone accounts for 55 of the “Supermarket” reports, 42 on Otford Road, 37 of the “Parking Area” ones and 31 on Buckhurst Avenue.
What happens to the cases
Anti-social behaviour reports carry no outcome in the data, so this covers the 61 recorded crimes in August 2026.
Twenty-nine had been closed with no suspect identified. Five were closed because police could not prosecute a suspect they had. The other 27 were still under investigation when the data was published.
Outcomes are added months after the event, so the newest month always shows a high share still open and understates how many cases eventually reach court.
How to check your own street
You can see every recorded crime, and the outcome of each case, for any postcode on the official police.uk street-level map. To report a crime, call 101, or 999 in an emergency, report online through Kent Police, or pass information anonymously to Crimestoppers on 0800 555 111.
Frequently asked questions
What is the most common crime in Sevenoaks? Violent and sexual offences, with 358 reports in the 12 months to August 2026. Anti-social behaviour and shoplifting are joint second on 223 each.
Is crime in Sevenoaks going up or down? Down overall. The four police neighbourhoods covering the town recorded 1,270 reports in the year to August 2026, against 1,399 the year before, a fall of 9.2 per cent. Burglary, vehicle crime and public order offences all fell sharply; shoplifting rose 14 per cent.
Is Sevenoaks safe? Crime figures alone cannot answer that. Read the trend over several months rather than one, remember that reports rise when policing rises, and check the police.uk map for your own street.
How often is this updated? The Home Office publishes street-level data once a month, about two months in arrears. August 2026 is the latest month available, and this page is refreshed when the new figures land.
Where does the data come from? The open data published at data.police.uk, used under the Open Government Licence.
Sources
- police.uk street-level crime open data (Kent Police neighbourhoods YC11, YC12, YC14 and YC15, August 2024 to August 2026, Open Government Licence v3.0)
- police.uk street-level crime map (search any postcode for the crimes and outcomes near you)
- Sevenoaks District Council, People and Places Advisory Committee minutes, 10 September 2026 (the district commander’s 3.1 per cent)
- Crimestoppers (report information anonymously on 0800 555 111)
Figures: police.uk street-level crime open data (data.police.uk), collected 30 September 2026 by posting the Kent Police neighbourhood boundaries for Sevenoaks Town and St John’s, Sevenoaks Kippington, Sevenoaks Northern and Sevenoaks Eastern to the street-level crime API, one month at a time, and removing duplicate records. Open Government Licence v3.0. Data is provisional. Chart by Sevenoaks Online.
Have your say